Data Analytics
The purpoose of data analytics is to look for trends and in raw data that indicate some form of correlation or relationship that may not have been clear previously. Research can be done to explain why factors are related, and prediction models can be created to guess how future changes will impact each other based on how strong those relationships are. Data analytics also serves to convey this relational information to others in ways that will be easy to comprehend, driving changes in business or policy.
Economics
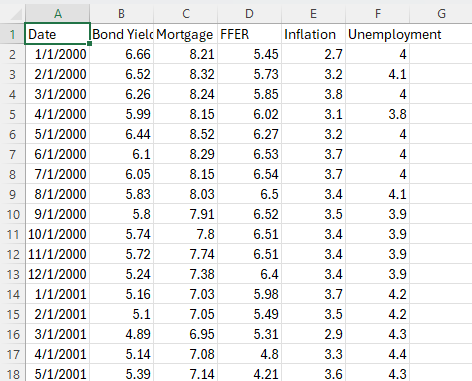
For my final project in the Data Analytics course, I sought to explain the impact of various economic factors on mortgage rate. I downloaded multiple datasets from The Federal Reserve Bank of St. Louis including: 30-year fixed rate mortgage rates, 10-year bond yield, federal funds effective rate, inflation rate, and unemployment rate for the last 25 years. I then combined all those data sets into one excel file as follows:
Using this data, I first built a heatmap to look for correaltion coefficients. These indicate how strong data is related to other factors in the daat set.
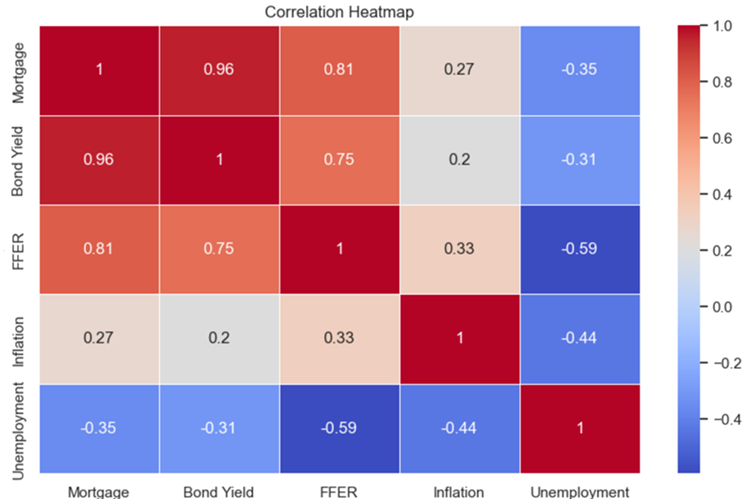
From this heatmap, we see that Bond Yield has a very strong correlation followed by FFER. graphing that correlation we can see how strongly the data follows the same trends.
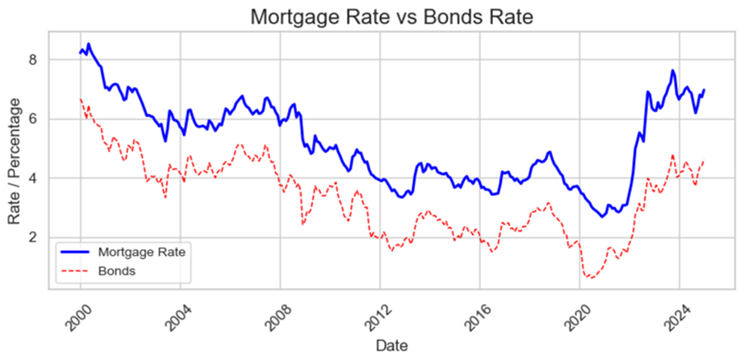
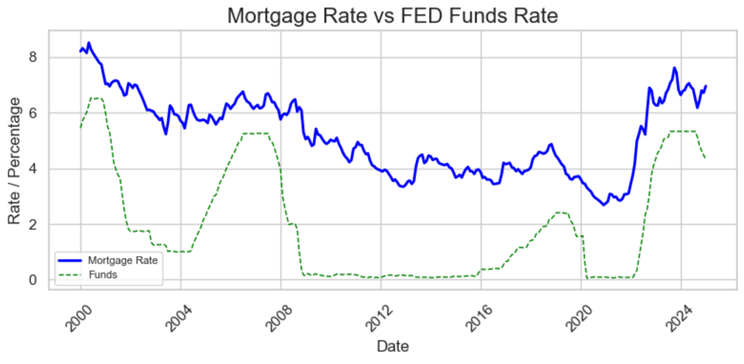
After exploring the relationship between these points of data, I found that mortgage prices are set primarily based on bond yields as they are in direct competiton to attarct investors. FFER rate drives mortgage prices by setting how expensive it is for banks to issue new real-estate loans. As operations get more expensive for banks, costs are passed to the consumer market in the form of increased interest rates.